How to use PPT to draw the table position map of the annual meeting? Use the ten-pointed star graphic to get it done.
ppt template article recommendation:
How to adjust the item number text with the PPT ruler
How to mark key points while demonstrating in PPT
How to compress PPT so that it can be sent by email
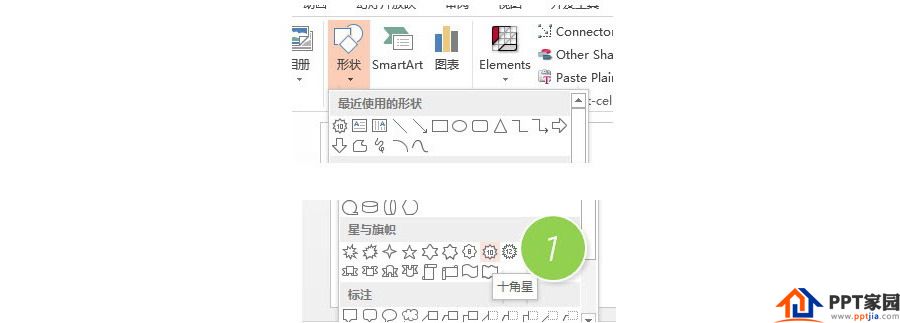
1. Create a new PPT document, hold down the Shift key and drag to insert a "ten-pointed star" shape. The effect is as follows:
2. After drawing the ten-pointed star, drag a circle, and drag the circle to the tangent point of the inner corner of the ten-pointed star (2 in the figure below), so that the circle is tangent to the two inner corners. Then copy the remaining 9 circles one by one to complete the production of the picture below.

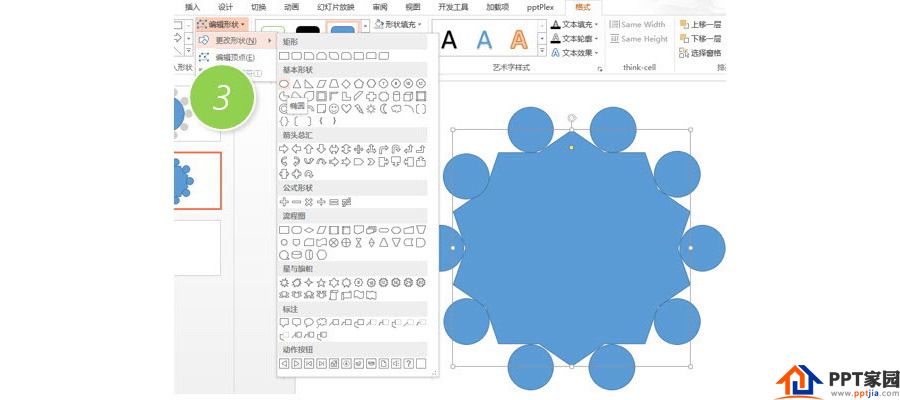
3. Then select the "ten-pointed star", and change it to a circle in Drawing Tools-Format-Edit Shape. Figure 3 below.
4. After changing to a circle, use Shift+Ctrl+drag the circle to make the big circle tangent to ten small circles.

Articles are uploaded by users and are for non-commercial browsing only. Posted by: Lomu, please indicate the source: https://www.daogebangong.com/en/articles/detail/How%20to%20draw%20a%20table%20location%20map%20with%20PPT.html
 支付宝扫一扫
评论列表(196条)
测试