ppt wants to draw a percentage expression graph, let's take a look at the detailed method below. For more downloads, please click ppt home.
ppt template article recommendation:
What should I do if the graph drawn by PPT is not closed
How to draw a flowchart with arrows in PPT
How to use the radar chart to draw a five-pointed star in ppt
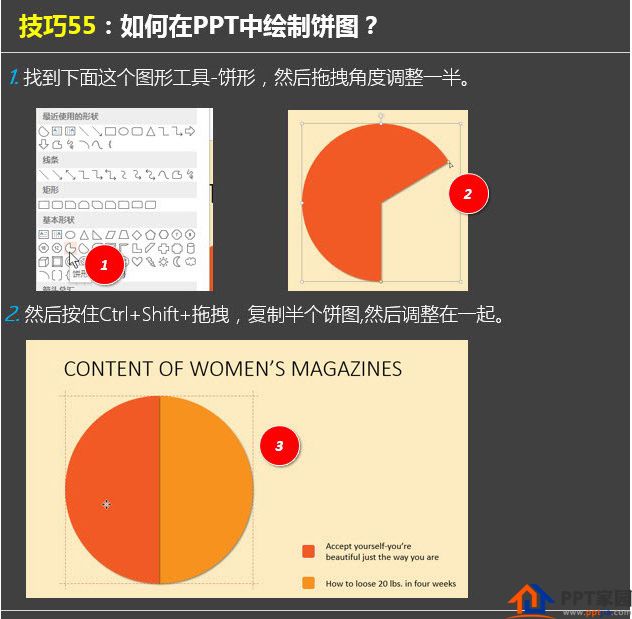
1. Find the following graphics tool - pie shape, and then drag the angle to adjust it by half.
2. Then hold down Ctrl+Shift+drag, copy half of the pie chart, and then adjust them together.
Articles are uploaded by users and are for non-commercial browsing only. Posted by: Lomu, please indicate the source: https://www.daogebangong.com/en/articles/detail/How%20to%20draw%20a%20percentage%20expression%20graph%20in%20PPT.html
 支付宝扫一扫
评论列表(196条)
测试