Are you still troubled by how to do the PPT Gantt chart? Today I will teach you how to do the PPT Gantt chart. For more downloads, please click ppt home.
1. As shown in the figure, click to insert a straight line, and then press shift to insert
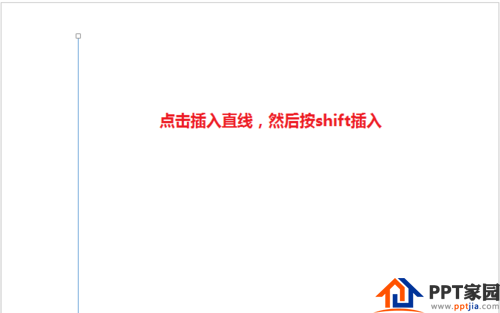
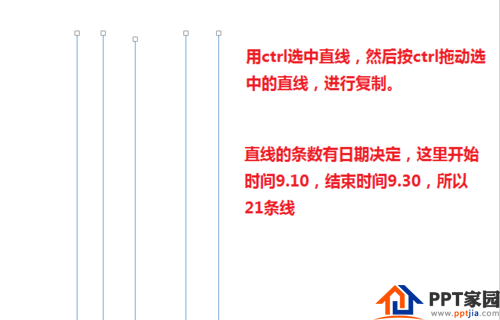
2. Hold down ctrl and drag a straight line to quickly copy, here are 5 lines.
Use ctrl to select these five straight lines, and then press ctrl to drag the selected lines to copy them.
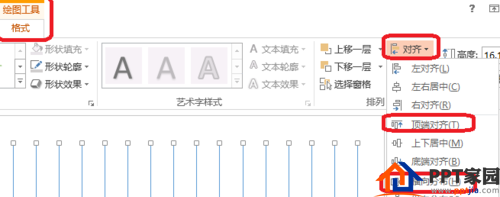
3. Select all the straight lines, click Drawing Tools (Format) - Align (Align Selected Objects) - Top Align - Horizontal Distribution.
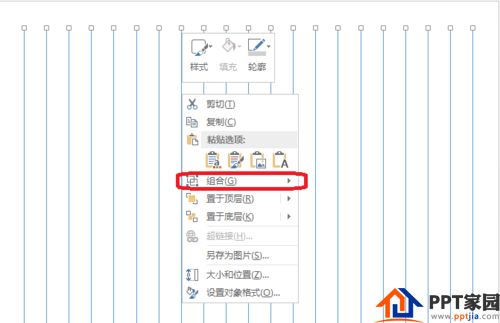
4. Right click - combination. Combine the straight lines, then insert the horizontal straight lines, and distribute them vertically to form a table as shown in the figure.
Of course, you can also insert the table directly. Make relevant transformations.

5. As shown in the figure, insert a text box, and then enter the time.
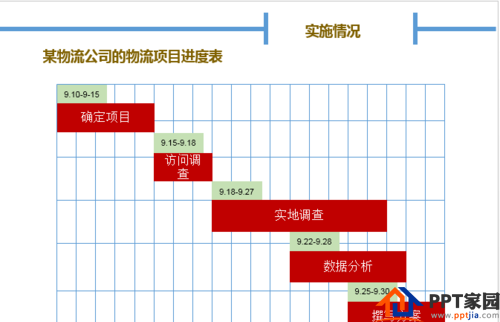
6. Using the rectangular shape, make a progress bar for the Gantt chart.
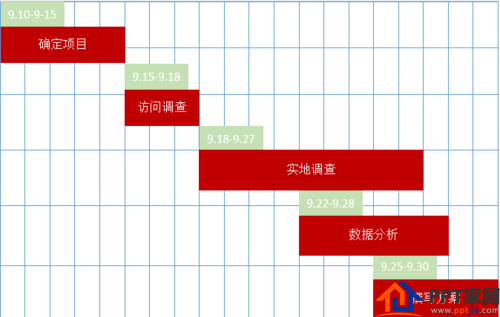
7. Beautify the Gantt chart and make the header.
ppt template article recommendation:
How to add focus effect to pictures in PPT
How to make a personalized percentage chart
How to make text float above the picture in PPT
Articles are uploaded by users and are for non-commercial browsing only. Posted by: Lomu, please indicate the source: https://www.daogebangong.com/en/articles/detail/How%20to%20do%20PPT%20Gantt%20chart.html

 支付宝扫一扫
评论列表(196条)
测试