In the PPT layout design, ring charts are all the rage. Just find a template, and there are ring charts in it. It is found that this ring diagram is still very distinctive. See if you can draw this circular graph. For more downloads, please click ppt home.
ppt template article recommendation:
What should I do if the graph drawn by PPT is not closed
How to draw multiple indicator arrows in PPT
How to draw a flowchart with arrows in PPT
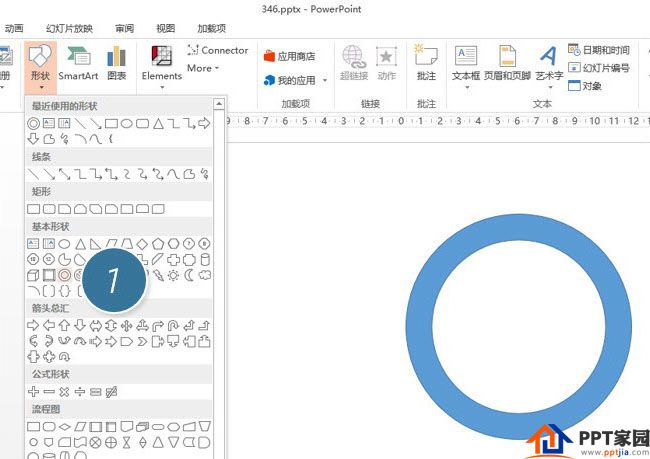
Create a new PPT and insert "Concentric Circle" in "Shape".
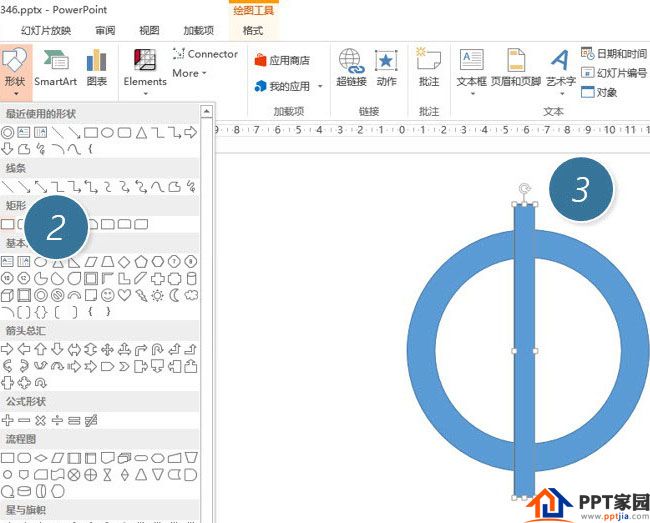
Next, insert a rectangle (2 in the figure below), pay attention to the small width of the rectangle, and ensure that the rectangle has a rotation adjustment button.
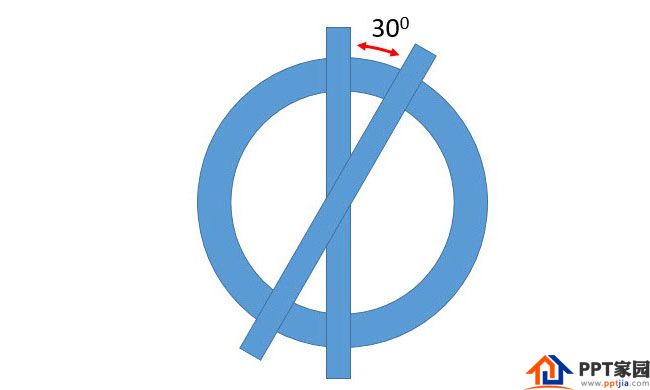
Next, copy a rectangle, hold down the Shift key, and drag the rotation adjustment button with the mouse to rotate every 15 degrees. Adjust to the 30 degree position. As shown below:
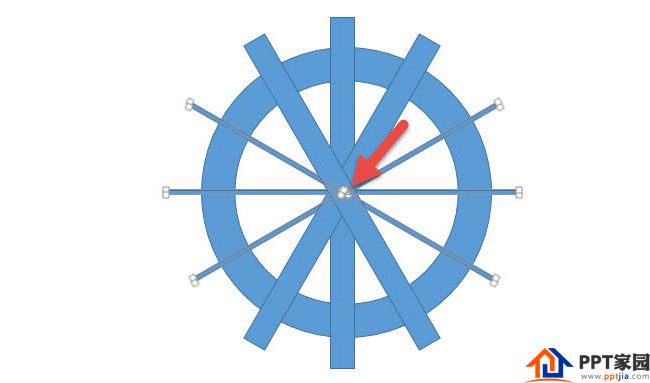
The effect after analogy:

The next important operation is to make the rectangular frame thinner. How to do it? Select the three rectangles in the image below. Hold down the shift+ctrl shortcut key, drag the position indicated by the arrow in the figure below, and adjust it to a very thin state.
In the same way, get the other three rectangles, then press Ctrl+A to select all the shapes, and click "Merge Shapes—Split".
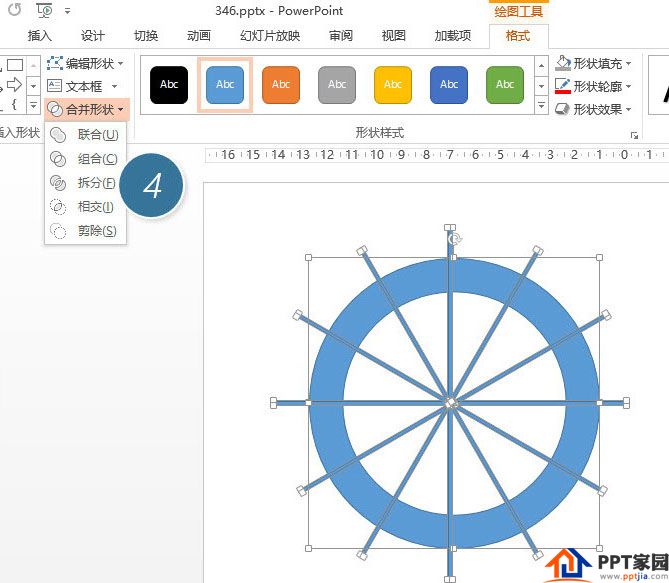
Remove unwanted parts after splitting.
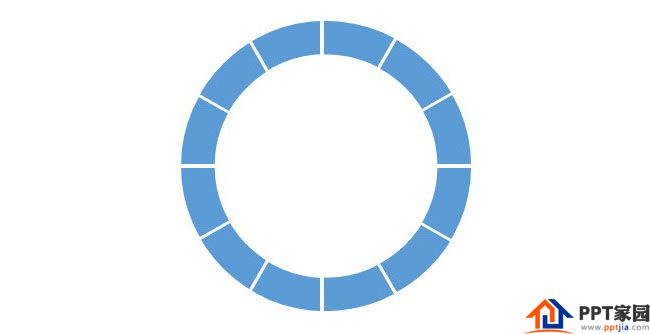
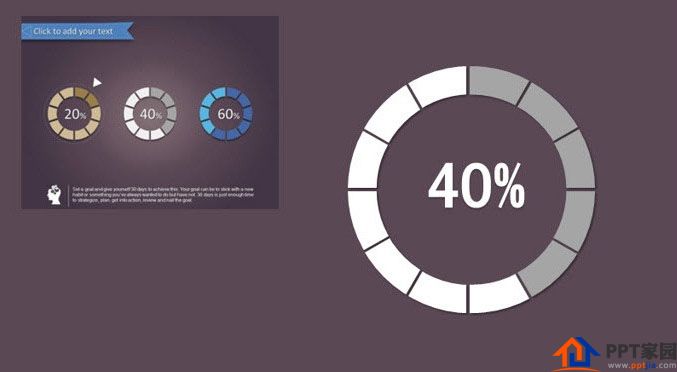
Next, use the color picker to get the color matching.
Articles are uploaded by users and are for non-commercial browsing only. Posted by: Lomu, please indicate the source: https://www.daogebangong.com/en/articles/detail/How%20to%20design%20a%20split%20ring%20chart%20in%20PPT.html

 支付宝扫一扫
评论列表(196条)
测试