If you want to design a donut chart in ppt, how should you design it? Let’s take a look at how to make a ppt donut chart. For more downloads, please click ppt home.
ppt template article recommendation:
How to make a personalized percentage chart
How to make dynamic charts displayed one by one in PPT
How to make two 3D charts in PPT
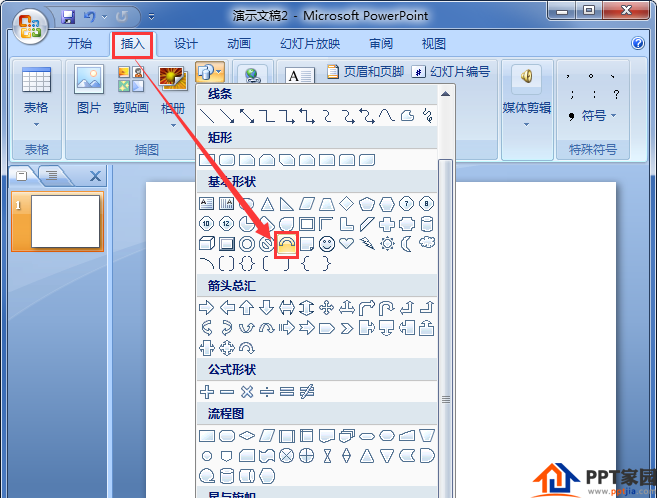
1. Open the PPT software to create a new document, click [Insert] in the basic shape, select [Hollow Arc], as shown in the figure;

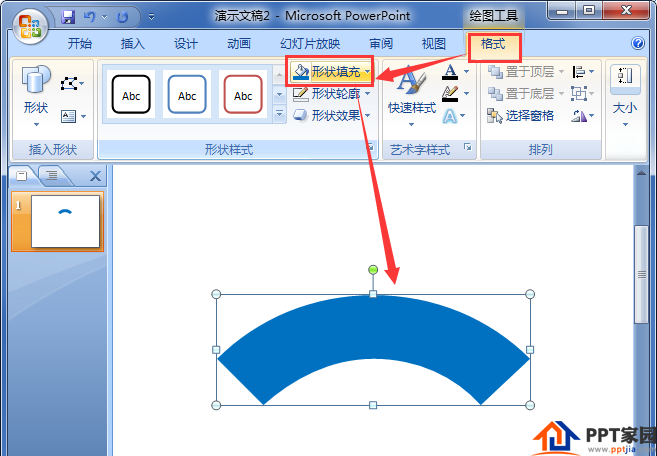
2. First draw a shape with a suitable size on the document, and set the fill color to blue, as shown in the figure;

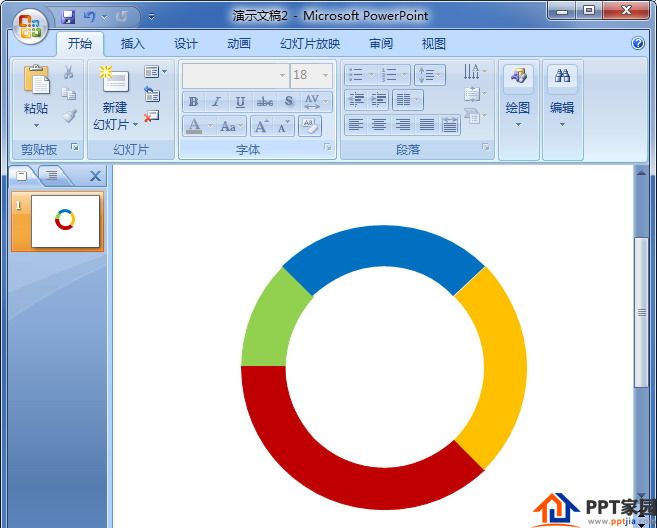
3. Follow the method in the second step above to draw the other 3 shapes, fill them with light green, red, and bright yellow respectively, and adjust the shapes to a suitable angle.

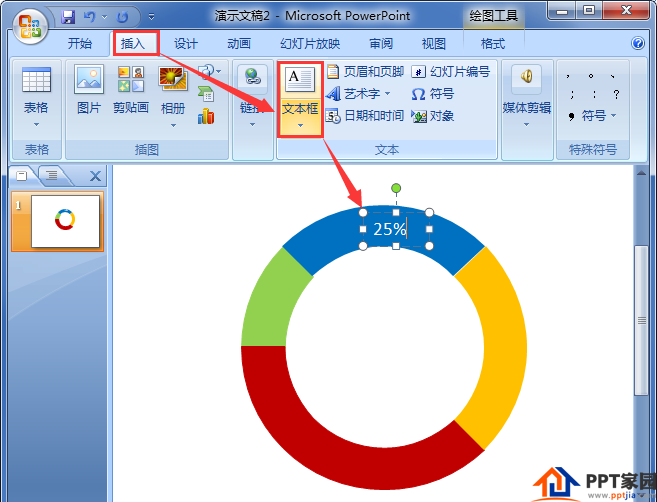
4. Use the text box to enter the percentage of the title at the top of the ring.
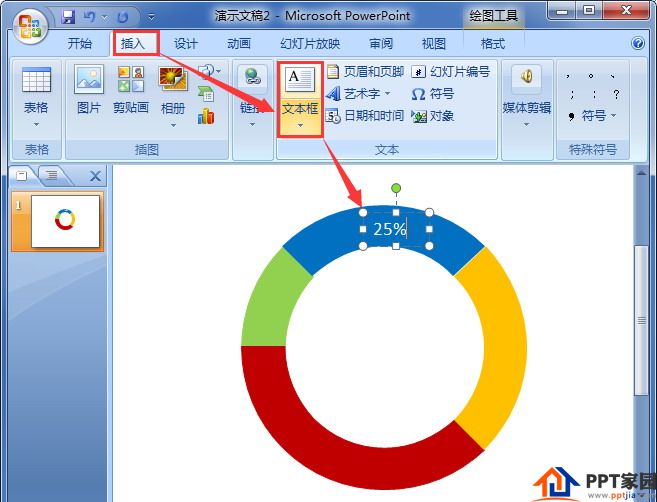
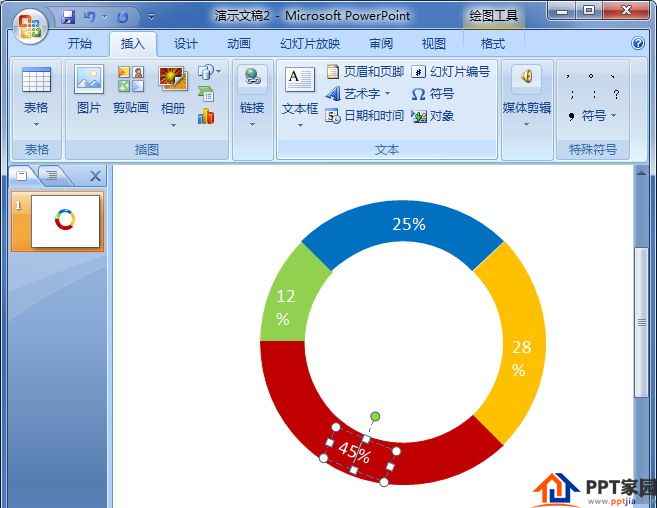
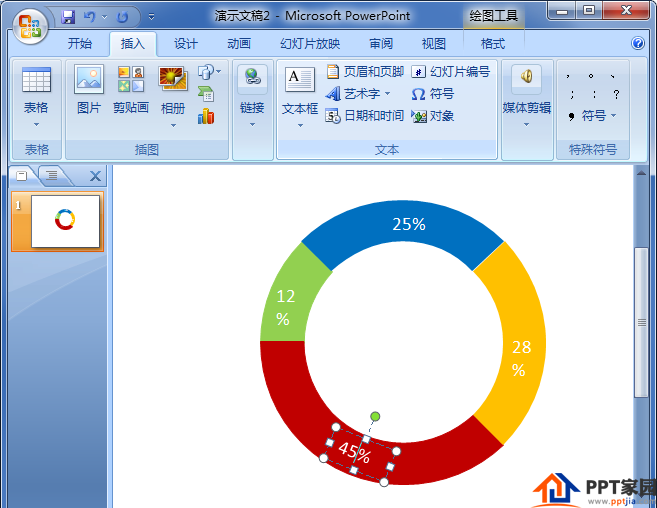
5. Copy a few more numbers in the text box, move them to three of the shapes, and rotate them to a suitable angle.
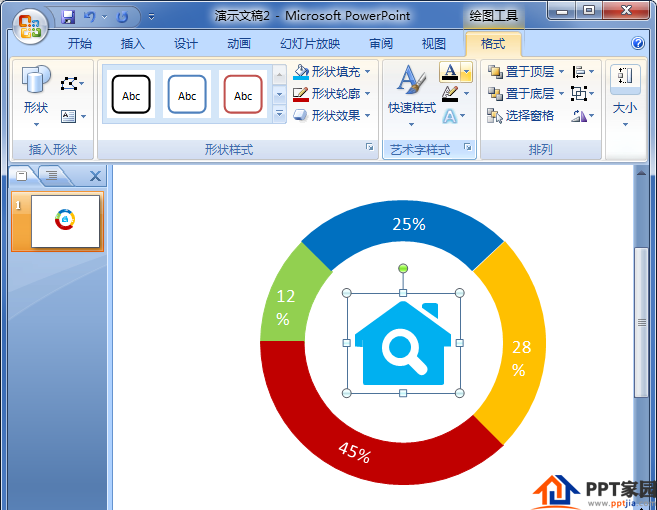
6. Finally, insert a figure in the middle of the ring to make it look more full.

Articles are uploaded by users and are for non-commercial browsing only. Posted by: Lomu, please indicate the source: https://www.daogebangong.com/en/articles/detail/How%20to%20design%20a%20percentage%20ring%20chart%20in%20ppt.html
 支付宝扫一扫
评论列表(196条)
测试