If you want to display data related to geographical areas, For example, the sales volume of enterprises in various provinces, the distribution of brands in cities, population flow, etc., maps must be the best choice.
✅Cool effects can bring a strong impact to readers
✅ Used in combination with other chart types, map display makes the visual effect of the report look more high-end and professional
✅Map can intuitively express the spatial relationship and distribution of data
Collect and share 3 map production methods and 10 map material source websites, suitable for different scenarios.

1. pixelmap
A high-definition map generator that provides the world with Vector maps within the range can be saved as charts or Html, and pixel maps full of technology can also be generated. It is easy to operate and can be used immediately after punching in. It is suitable for some simple map marking scenarios.
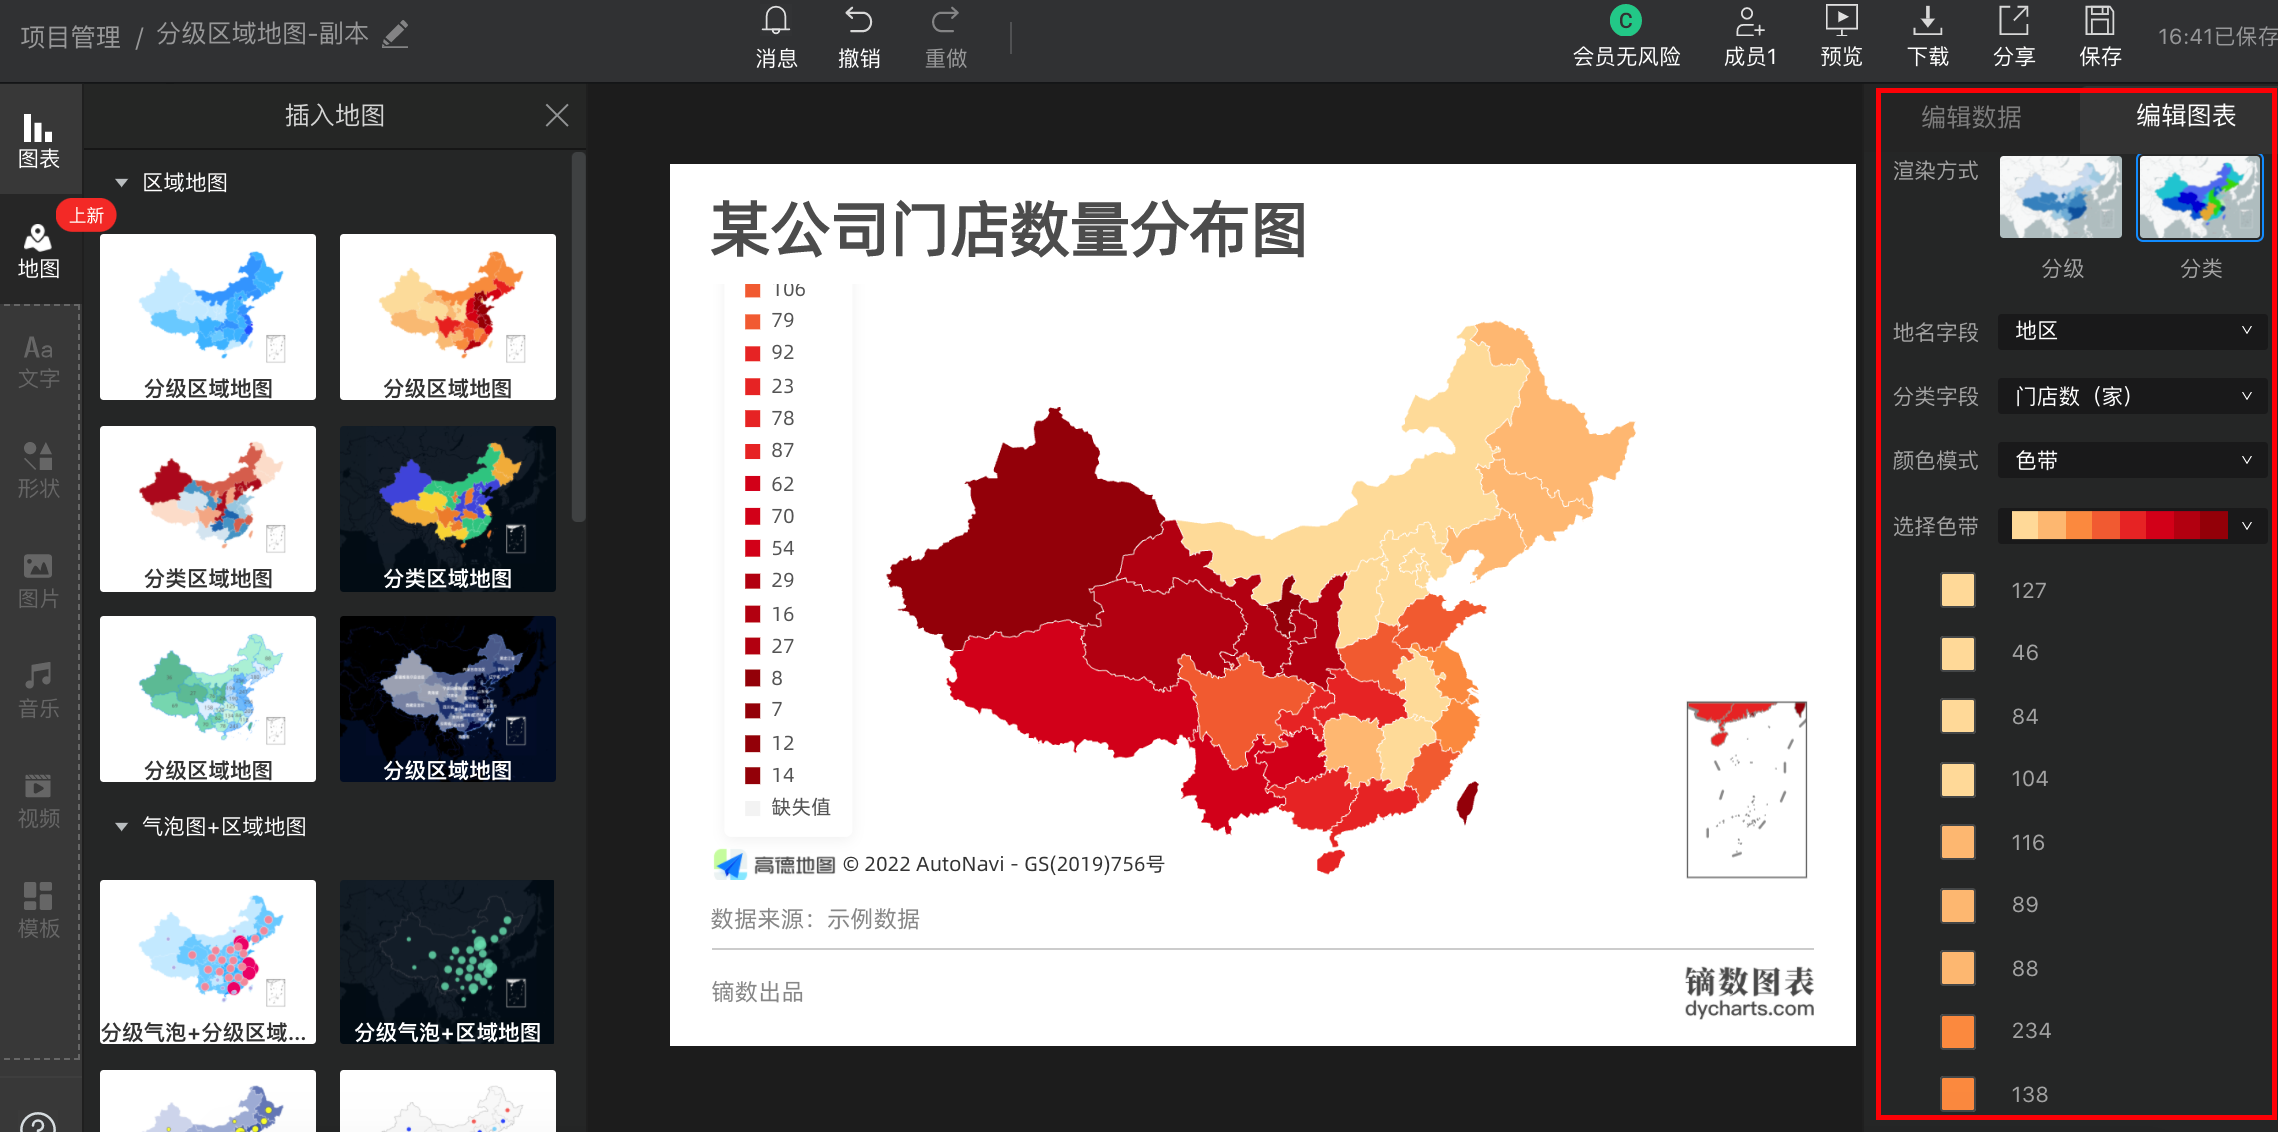
2. Dysprosium chart
0 code online visualization tool, providing 22 types The map chart type selection allows you to switch between China map/world map/province and city maps, which is a very convenient tool.

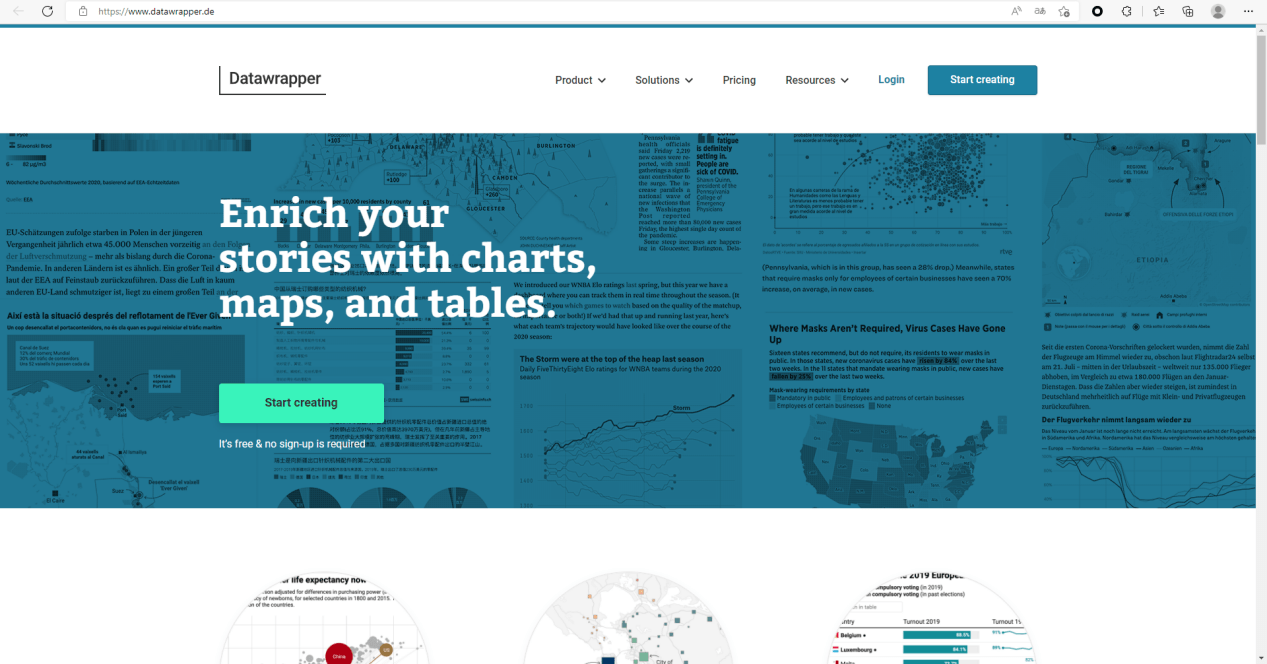
3. Datawrapper
A free chart gadget that does not require registration and can generate various summary graph. Once you upload your data, you can easily create and publish charts and maps. Visualizations can also be perfectly integrated on the site using custom layouts. The disadvantage is that there is currently no Chinese version.

The following websites can quickly download map material pictures and can be used in combination with the above three websites:
- NB Map (visual map website, can automatically generate three-dimensional maps. And the color, thickness, border, light effect, angle and other values can be adjusted . And supports downloading in multiple formats, suitable for science and technology PPT)
- National standard map service (officially certified, absolutely accurate! The public can browse and download standard maps for free, download The map is provided in EPS format and can be edited directly. The map approval number needs to be marked when using it)
- Alibaba Cloud (Alibaba data visualization platform, supports downloading in svg format) < li data-track="40">Bigmap (personalized vector map, topographic map)
- DataV.GeoAtlas (a professional geographical tool. The easy-to-use point is that it can Quickly select the outline map of a certain area and download it in SVG format for later editing)
- Amap Open Platform (Amap can also generate maps! In the open platform, you can Modify the color/style of map elements and text annotations in the area)
- Baidu map open platform (similar to Amap, a variety of different styles are preset in the platform Color matching, and you can extract pictures to re-color the map)
- Cadmapper (there are more than 200 free city maps in it, which are very detailed. It has attracted four fans in Asia alone. Ten city maps, all in CAD format, very suitable for architects and urban planners)
- freevectormaps (more than 27,000 free vector maps, supports AI format download)< /li>
- snazzymaps (a foreign map website, which has 4,000 pages of map style options, and you can customize the location, style, color, language, etc. You can copy the code to embed the map into the website Medium)
That’s it for today’s Amway, good tools will help you get twice the result with half the effort!
Articles are uploaded by users and are for non-commercial browsing only. Posted by: Lomu, please indicate the source: https://www.daogebangong.com/en/articles/detail/3-kuan-chao-hao-yong-di-tu-zhi-zuo-ruan-jian-men-kan-ye-neng-zuo-chu-hao-kan-di-tu.html

 支付宝扫一扫
评论列表(196条)
测试